Options Map — the live BTC & ETH gamma surface
The entire Deribit options surface on a single heatmap — strike by expiry. Five switchable layers, per-strike Greeks on hover, a vol smile per expiry and a gamma-flip and max-pain table — the read that tells you when the market pins and when it sprints.
Why it exists
In options markets, dealers set the rules — not retail. Where they're long gamma, their hedging dampens moves and price mean-reverts; where they're short gamma, their hedging chases momentum and moves accelerate. Read that surface right and you know in advance whether the market is likely to breathe out or break out.
The problem is that this picture is usually split across several expensive, single-purpose tools — one for the gamma profile, another for the vol smile, another for Greeks. Options Map puts all of it on one heatmap, for BTC and ETH, refreshed continuously.
What you get
Five ways to read the surface
| Layer | What it shows | What you read |
|---|---|---|
| Net Gamma | Per-strike net gamma, red (short) to green (long), with sign-flip levels | Where dealers stabilize vs amplify price |
| Imbalance | Call OI vs put OI per strike | Which side positioning is skewed — speculation vs protection |
| Open Interest | Total OI per strike, dark to bright | High-OI walls that act as magnets near expiry |
| Volume | 24h volume traded per strike | Active strikes vs dormant ones — where flow is going now |
| Concentrations | Top strikes by combined gamma, OI and volume | The handful of strikes that matter most today |
When dealers are net long gamma they sell rallies and buy dips — volatility contracts and price pins to big strikes. When they're short gamma they chase momentum — volatility expands and moves accelerate. The Net Gamma layer maps exactly where that line sits, and the gamma-flip level is the price where behaviour changes character.
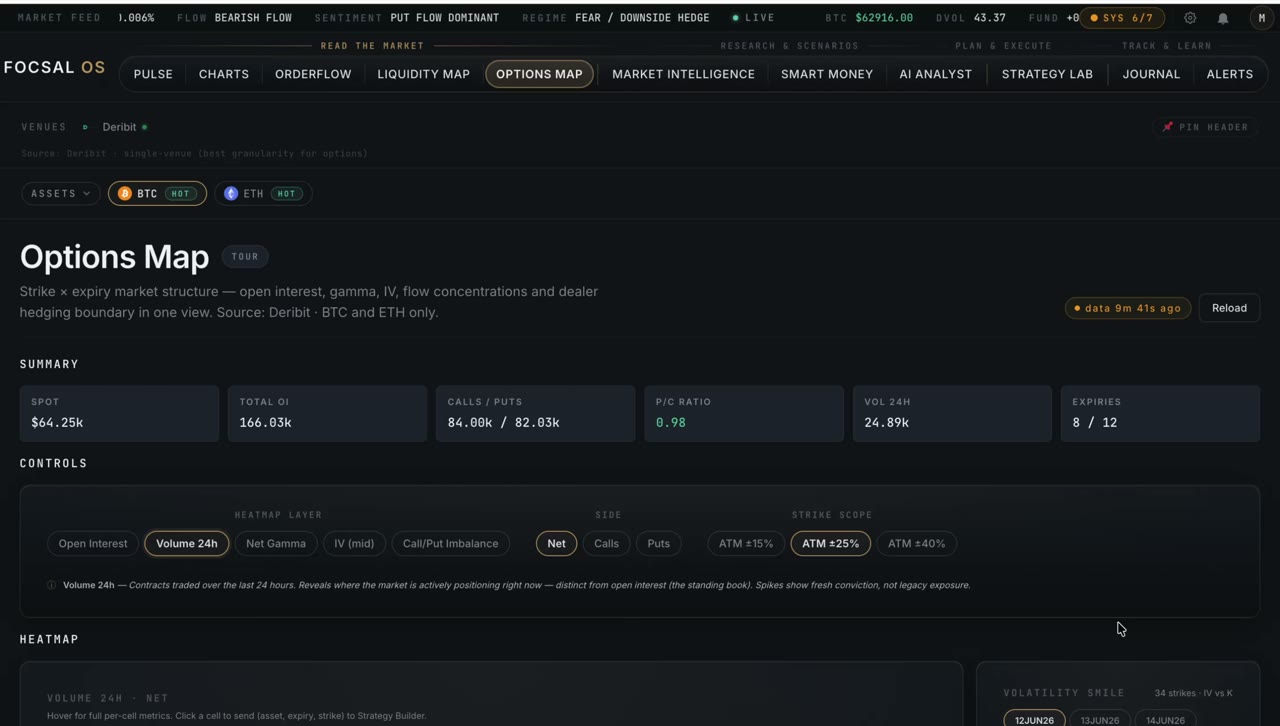
The header summary
Six tiles set the context before you touch a layer: spot and 24h change, ATM IV on the nearest expiry, realized HV and the IV/RV ratio (is vol rich or cheap), total open interest, the top-5 strike concentrations, and the term state — contango, backwardation or flat.
Vol smile & per-expiry table
Beside the heatmap, a vol smile draws implied volatility across strikes for any expiry you pick, with a spot line and hover-snap to the nearest strike. Below it, a per-expiry table lists ATM IV, the gamma-flip price, max pain, net GEX and the put/call ratio — so you can read the whole term structure of risk in one place rather than reconstructing it expiry by expiry.
Options Map sources from Deribit alone — and that's deliberate. Around 85% of crypto options open interest lives there, so a single venue gives the cleanest, most granular surface. Aggregating thin venues would add noise without adding meaningful coverage.
How it works
A snapshot worker computes the full surface for BTC and ETH every few minutes — including per-strike Black-Scholes Greeks baked in — and writes it to a single fast store. The module reads and slices that snapshot in the browser, so hovering cells, switching layers and redrawing the smile happen in milliseconds with nothing recomputed client-side. Gamma-flip levels are interpolated across listed strikes, so they land on real price levels even between quoted strikes.
The gamma regime you read here is the same signal the Options engine inside Market Intelligence votes with, and the dealer-gamma profile that Pulse surfaces for a quick read. One options snapshot, used everywhere — no drift between what you see on the map and what the rest of the system acts on.
Open Options Map on the live market
The full BTC & ETH gamma surface, vol smile and Greeks — included in the Enterprise plan.
See plans