Smart Money — what institutions are doing before the crowd
TradFi institutional positioning from weekly CFTC reports. See how asset managers, leveraged funds and dealers are positioned in BTC, ETH and SOL futures — the slow money that moves before crypto Twitter catches on.
Why it exists
Most crypto analytics only see crypto-native flow — order flow, liquidity, options. They're blind to what the largest, slowest players are doing in regulated futures markets. Yet that's exactly where institutions reveal their hand: weekly, in public CFTC reports, days before the move shows up on a chart.
Smart Money brings that institutional layer into the platform. It reads the CFTC's weekly positioning data, breaks it into the categories that matter, and tells you in plain language what the slow money is building — and crucially, when an institutional position is not what it looks like.
What you get
The five categories
| Category | Who they are | What it signals |
|---|---|---|
| Asset Managers | Pension funds, insurers, large allocators — the slowest, "smartest" money | Long-horizon institutional flow — the primary signal |
| Leveraged Funds | Hedge fund CTAs and trend-followers | Momentum positioning — but basis-trade aware |
| Dealers | Sell-side market makers | Forced delta hedging — mechanical, not directional |
| Other Reportables | Mid-size funds and family offices | Crowd-positioning context |
| Non-Reportables | Small traders, below reporting threshold | Contrarian signal — extremes often mark tops and bottoms |
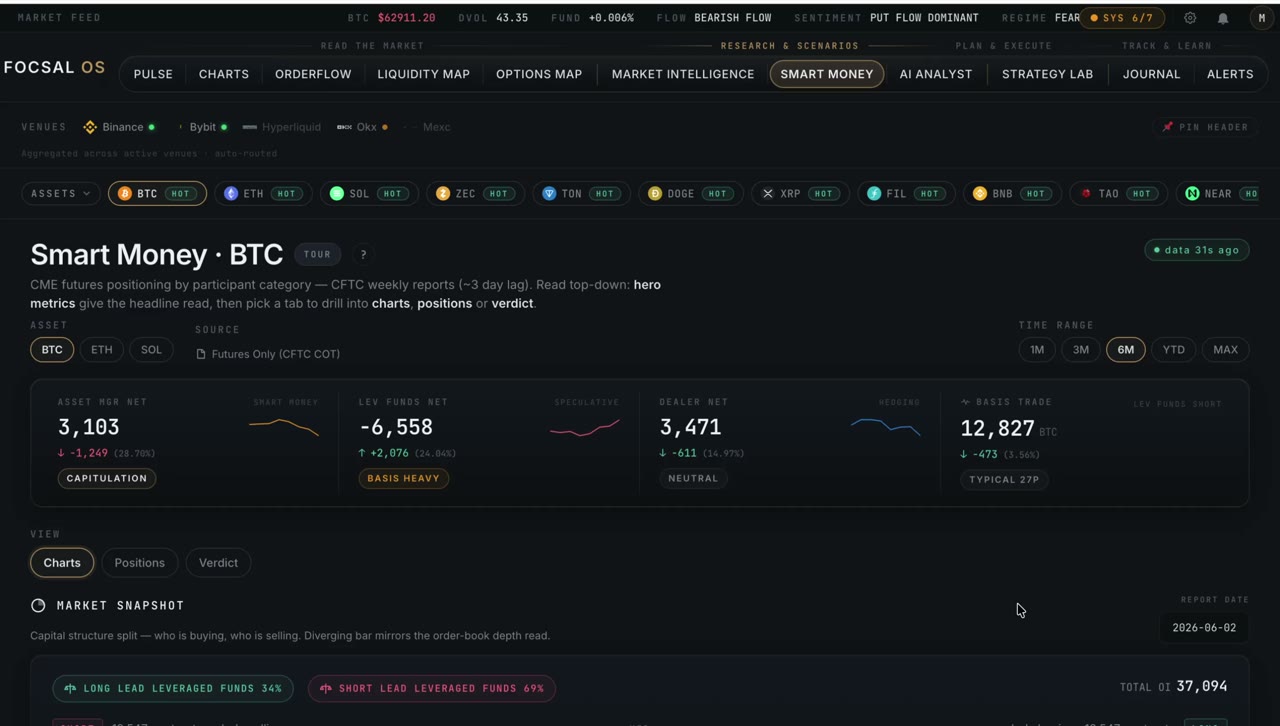
When leveraged funds go heavily short BTC futures, it looks bearish. Often it isn't — they're long spot and short futures to capture the basis, a market-neutral carry trade. Smart Money flags this automatically when a fund short rises alongside a dealer long, so you don't mistake arbitrage for a directional view.
How you read it
The module opens with a verdict — UP, DOWN or RANGE with a confidence read and a freshness indicator, since CFTC data publishes weekly. Below it, five category cards show each group's net position, weekly change, percentile rank against history, and a plain-English interpretation. A history chart lets you overlay categories across ranges from three months to several years, and a synthesis tab spells out what to watch next — like an asset-manager position approaching a historical extreme.
Institutions don't treat BTC, ETH and SOL the same. It's common to see smart money clearly long one and neutral on another, even when the crypto-native picture looks identical — a dimension you simply can't get from price alone.
Smart Money isn't just a standalone dashboard — it's also the fifth engine inside Market Intelligence, contributing the institutional vote to the combined verdict. Used together with Order Flow and Liquidity Map, it becomes a confirmation layer: smart money long + strong order flow + a liquidity bounce is a three-way confluence.
See institutional positioning
CFTC positioning for BTC, ETH and SOL with percentile context — Smart Money is available on the free plan.
See plans